
CSIR NET June 2016 Q14: Quantitative Aptitude
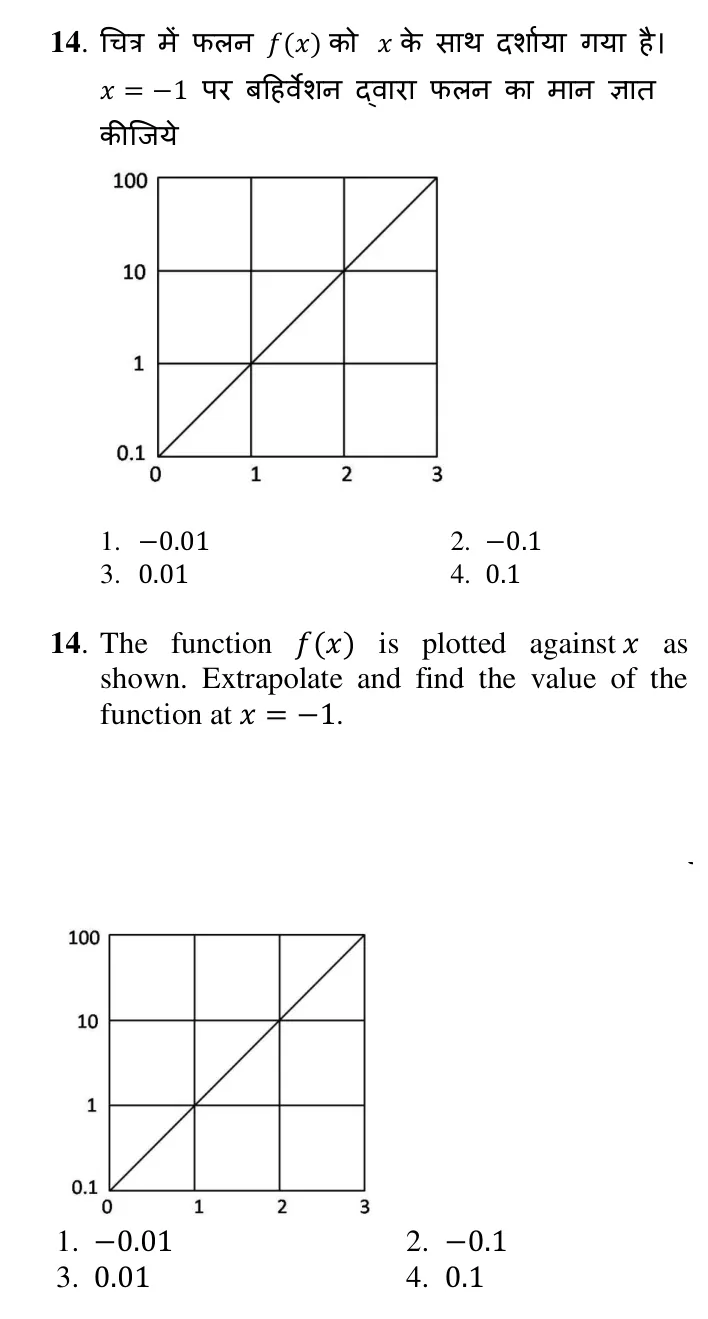
On a semi-log plot (linear x-axis, logarithmic y-axis), a straight line represents an exponential function of the form f(x) = A·10^(kx). The line's intercept at x = 0 gives A, and its slope (in decades per unit x) gives k.
From the graph, the line passes through (x=0, f=0.1) and (x=3, f=100).
At x = 0: f(0) = A·10^0 = A = 0.1
At x = 3: f(3) = 0.1 × 10^(3k) = 100
10^(3k) = 1000 = 10^3
3k = 3 → k = 1
So f(x) = 0.1 × 10^x
Extrapolating to x = -1:
f(-1) = 0.1 × 10^(-1) = 0.1 × 0.1 = 0.01
At x = 0: f(0) = A·10^0 = A = 0.1
At x = 3: f(3) = 0.1 × 10^(3k) = 100
10^(3k) = 1000 = 10^3
3k = 3 → k = 1
So f(x) = 0.1 × 10^x
Extrapolating to x = -1:
f(-1) = 0.1 × 10^(-1) = 0.1 × 0.1 = 0.01
Option 1 (-0.01) is wrong sign — the function value from an exponential of this form is always positive, never negative.
Option 2 (-0.1) is also negative and additionally off by a factor of 10.
Option 3 (0.01) is correct, obtained by extrapolating the exponential trend one unit below x = 0.
Option 4 (0.1) is the value at x = 0, not x = -1 — a common error from forgetting to extrapolate one full decade further down.
Option 2 (-0.1) is also negative and additionally off by a factor of 10.
Option 3 (0.01) is correct, obtained by extrapolating the exponential trend one unit below x = 0.
Option 4 (0.1) is the value at x = 0, not x = -1 — a common error from forgetting to extrapolate one full decade further down.